MgluR5: Pose Prediction on GPCRs
Metabotropic glutamate receptors (mGluRs) are high-profile G-protein coupled receptors drug targets because of their involvement in several neurological disease states, and mGluR5 in particular is a subtype whose controlled allosteric modulation, both positive and negative, can potentially be useful for the treatment of schizophrenia and relief of chronic pain, respectively.
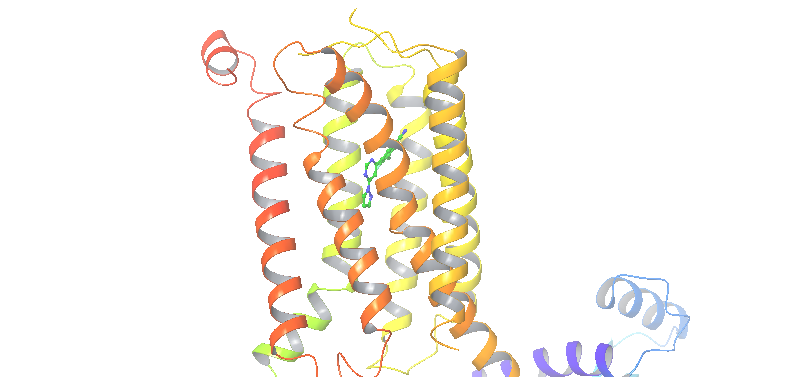
Fig. 6 MgluR5 system
Objective
The aim of this project is to find the binding pose of MgluR5 complexed with a benzonitrile NAM.
Preparation
To start the simulation we need complex.pdb and input.yaml
Receptor
PDB: 5cgc. The holo structure with the ligand crystal at the entrance of the GPCR was processed with Protein Preparation Wizard at pH 7.4 (Schrodinger).
Procedure: AdaptivePELE Local Exploration
Main Charachteristic of the simulation
Bias towards the orthosteric site
Starting pose for PELE Local Exploration (check box definition)
Processors: 64
Compute time: 2-3h
ControlFile specifics
Special required parameters for this simulation are:
system: '5CGC_entrance.pdb' #Input pdb with ligand-protein in the desired initial structure
chain: 'C' #Ligand chain
resname: 'CGC' #Ligand residue name
box_radius: 30.0 #Radius of the box to explore with PELE
seed: 12345 #Seed of the job
bias_sim: true #This will create a bias the specified column of the report. IN thins case interaction energy
bias_column: 5 #Column of the report to make the bias to
traj_name: 'trajectory.xtc' #Output files with xtc format and trajectory as name
rmsd_pdb: '5CGC_native.pdb' #At each PELE step generate the RMSD of the ligand in respect to the mentioned pdb
cpus: 100 #Number of cpus. You will obtain as many trajectories as cpus-1
Results
To analyze the simulation we will:
1) Plot the Binding Energies vs RMSD
Plot the Binding Energies vs RMSD to check whether there is a minima at low RSMDs. To know more about the command, check here.
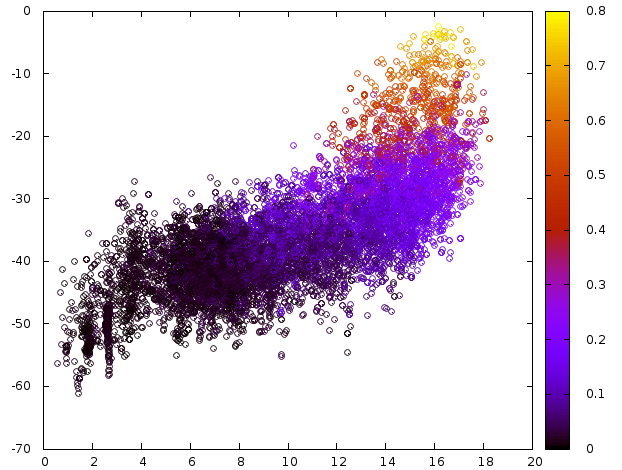
Fig. 7 Plot Binding Energy (Y-axis), RMSD to native pose (X_axis) and SASA (Z-axis)
2) Extract the best structures in terms of BE and RMSD
Extract the best snapshots. For more on extracting the best snapshots with InteractivePlot, plese refere here.
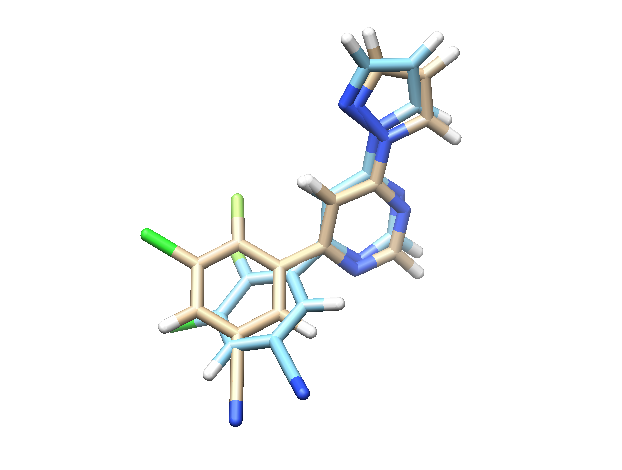
Fig. 8 In blue we have the crystal structure and in brown the pose predicted by PELE
3) Extract a movie from the best structure
To map the movement of residues along the ligand exit pathway, make a movie as described here and display all the residues close to the ligand in one Figure to see their fluctuations (see below).
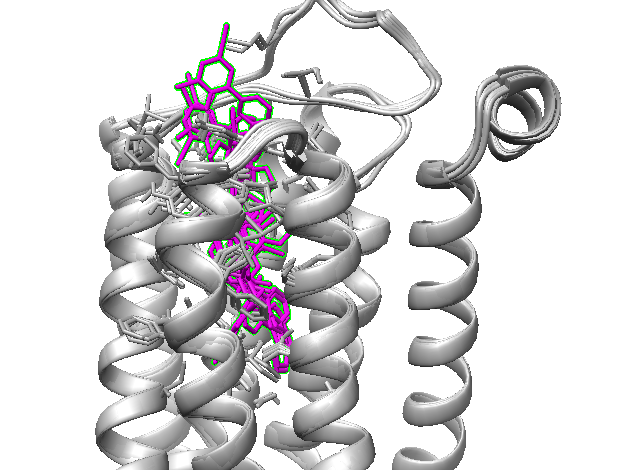
Fig. 9 Movie of the entrance path of the best structure in terms of binding energy
4) Comparison with PELE simulation
As we can see in the figure below Adaptive explores much more around the binding site area but also undersamples other parts of the energy landscape. Despite of having much more exploration in the binding site the energies are not so high as in the PELE simulation due to Adaptive clustering (At the end of the simulation we cannot create more clusters and we always repite the same steps). Finally, adaptive got to the binding sit in 20 min while PELE took 3-4h. Hence, if we know the binding site of the ligand we should use AdaptivePELE to reach the area and add a final induced fit PELE simulation to get the best possible energy.
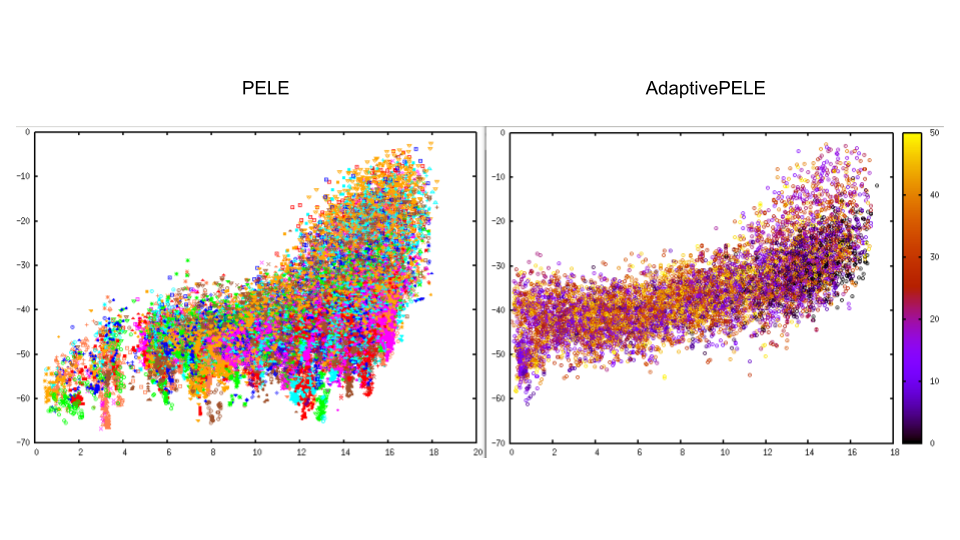
Fig. 10 Comparison between PELE and AdaptivePELE simulation