RoRγ: Dissociation Pathway to guide unbiased binding simulation
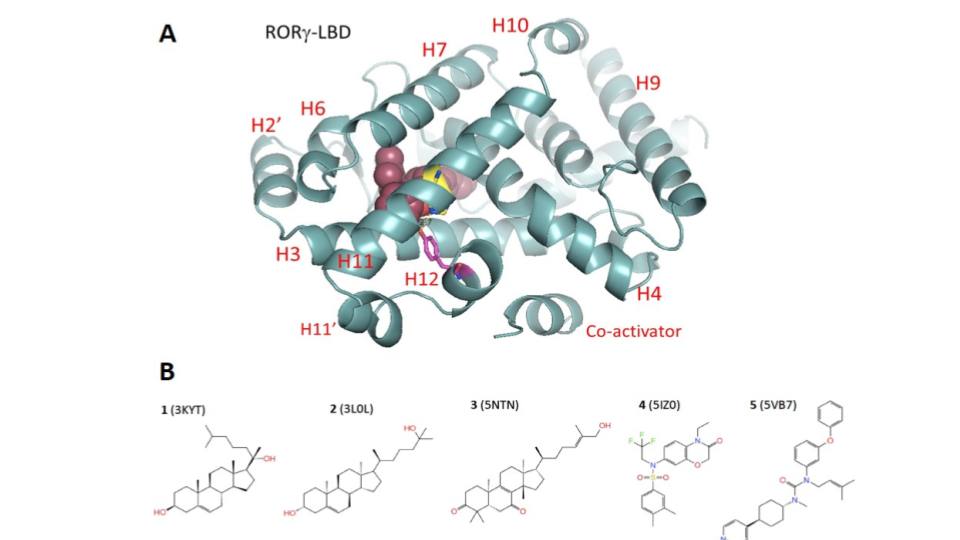
- The Retinoic-acid related-orphan-receptor-C (RORC or RORγ) belongs to the nuclear hormone receptor (NHR) superfamily. It plays a fundamental role in the maturation of IL-17 producing Th17 cells is thus an attractive target for a variety of autoimmune diseases such as psoriasis and rheumatoid arthritis. RORγ features a multidomain structure characterized by an N-terminal DNA binding domain (DBD) and a C-terminal ligand-binding domain (LBD) capable of binding ligands and recruiting co-activator or co-repressor proteins. The LBD is a compact globular structure rich in α-helices. Its ligand-binding site is located deeply at the core of the domain. Inspection of all co-crystal structures does not reveal an obvious entry path into this deep buried site. An interesting and unresolved question remains related to how compounds active on RORγ-LBD
diffuse in and out of the binding site, which is at the core of the LBD.

Fig. 1 RoRγ system
Objective
To explore the exit pathway of ligand from the protein-ligand bound complex.
Preparation
To start the simulation, we need the complex.pdb an the input.yaml
Receptor
Process the protein complex (PDB id: 5VB7) with Protein Preparation Wizard (Schrodinger Program Suite) at pH 7.4 ± 0.5 to assign the protonation state to all ionizable residue as well as optimize the H-bond network.
Procedure-Part 1: PELE Exit Path
Main characteristics of the simulation
Using the starting structure from protein-ligand crystal complex.
AdaptivePELE mode: “Unbinding”. This will move the ligand towards the bulk little by little.
Processors: 20 processors
Compute time: 1-2 hours
Control File Specifics
system: '5vb7_prw.pdb' # Complex input
chain: 'Z' #Ligand chain
resname: 'AGO' #Ligand resname
seed: 12345 #Seed
in_out: true #  This will set the box on the COM of the ligand and make small succesive simulations that start from the outputs with biggest SASA of the previous simulation
cpus: 20 #Number of CPUS. You will obtain cpus-1 montecarlo trajectories
Launch Command
python -m pele_platform.main input.yaml
Results
Exit Plot
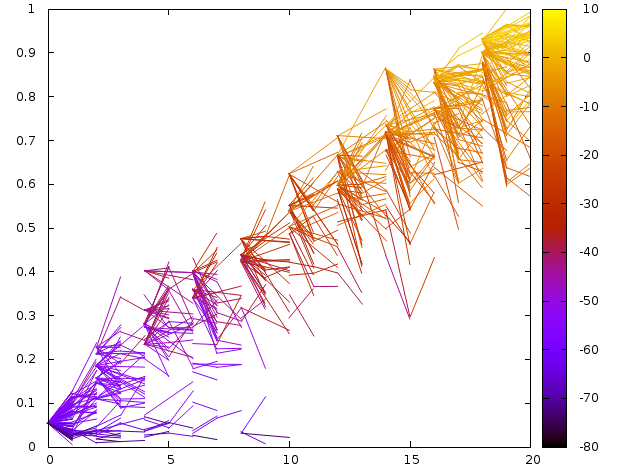
To monitor the exit path we plot the SASA vs the number of steps

Fig. 2 Plot of Pele steps (X-axis) SASA (Y-axis) and Binding Energy (Z-axis).
Important residues in exit path
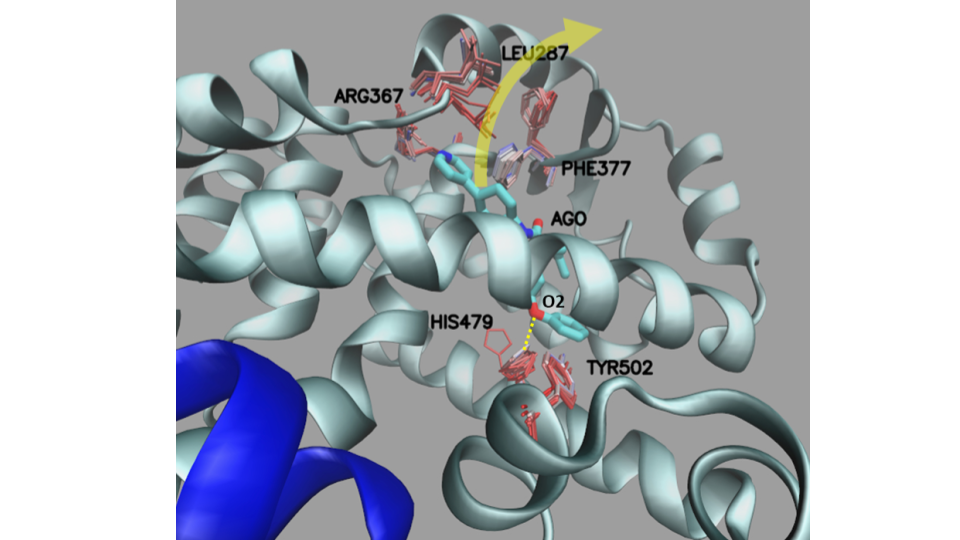
To map the residues movement along the ligand exit pathway from the trajectory make the movie as described here and plot all the residues close to the ligand of all snapshots together to see their fluctuation as seen in the Figure below.
To map the movement of residues along the ligand exit pathway, make a movie as described here and display all the residues close to the ligand in one Figure to see their fluctuations (see below).

Fig. 3 The important residues along the dissociation pathway.